Technical assessment
Last updated: May 2022
Task 0: Set up
To be able to complete the tasks specified in this repository you will need this repository, an internet connection and a local installation of Node (v10 or above). You can use your preferred IDE to complete this task. Click on the Task Playground tab for instructions on getting started with the project.
- deal with new libraries;
- structure your work;
- style the elements;
- pay attention to details;
- Resources
- Styling Framework
- tailwindcss
- Framework
- Next.js
- Primary library
- React
- Language
- TypeScript
- API Standard
- GraphQL
Task 1: Connect to GraphQL Server and fetch audio data
We have set-up a GraphQL server, you can expore the API via the GraphQL Playground. The documentation can be accessed by pressing the Docs button on the right handside. We have set-up Apollo client to connect our GraphQL Server in this project, you can start querying the server from the code (refer to the Apollo documentation if needed)
- Resources
- GraphQL Server
- https://papercup-fake-server.vercel.app/api/demo
- Apollo Client Documentation
- https://www.apollographql.com/docs/react/data/queries/#executing-a-query
Goal: Fetch a audio with id, name and S3 URL fields from the API with an ID of 'papercup'
Task 2: Display the audio in with Wavesurfer
The wavesurfer library provides an easy way to visualize the audio as a waveform. Utilise the library to create a waveform of the audio file.
- Resources
- Wavesurfer
- https://wavesurfer-js.org/examples/
Goal: Display the waveform of the 'papercup' audio with wavesurfer
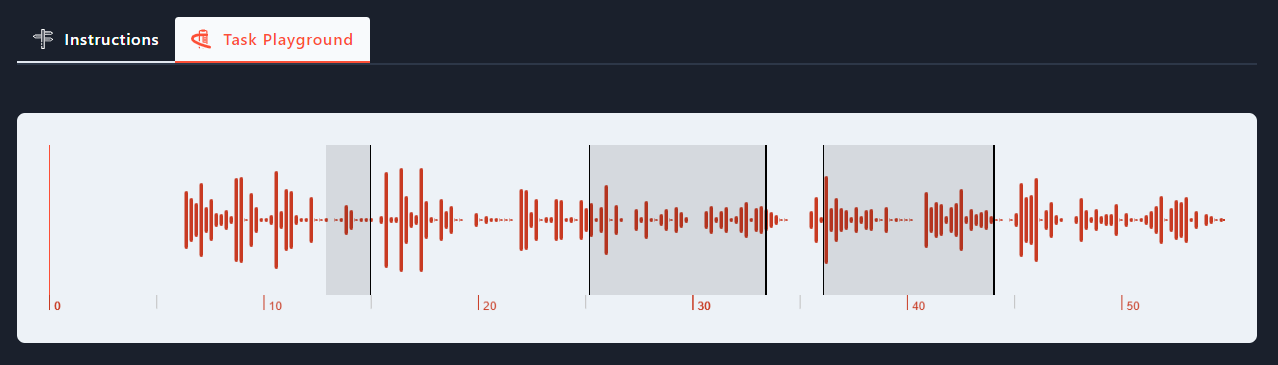
Task 3: Style the WaveForm
Using the Wavesurfer library's API and Timeline plugin , style the waveform as shown below, or you can get even more creative.
- Resources
- Wavesurfer
- https://wavesurfer-js.org/examples/
- Colours
- Primary rgb(252, 78, 54), Secondary rgb(200, 58, 34)
Goal: Make the waveform look sleak
Task 4: Add annotations to the timeline
The GraphQL library returns annotations as part of the audio object, visualise the annotation on the waveform by using the API provided by Wavesurfer.
- Resources
- Wavesurfer Region Docs
- https://wavesurfer-js.org/api/class/src/plugin/regions/index.js~RegionsPlugin.html
Goal: Add annotations on top of the waveform
Task 5: Display annotations
We would also like to display our annotations below the waveform, and be able to play each annotation. The design of the each container is up to you, you can find assets for play and pause buttons in the /components/assets/svg folder. All the nessary libraries are installed for you to be able to import SVGs (see Header.tsx for an example)
- Resources
- Wavesurfer Region Docs
- https://wavesurfer-js.org/api/class/src/plugin/regions/index.js~RegionsPlugin.html
Goal: Add ability to play each annotation and display each annoation
Task 6: Merge the annotations together if they overlap
Two or more annotations may overlap, and we would like to merge them into one annotation and visualise that on the timeline we have created in the previous tasks
Example:
Input: intervals = [[12.9, 15.0],[14.2, 26.5],[27.2, 33.5]]
Output: [[12.9, 26.5],[27.2, 33.5]]
Explanation: Since intervals [12.9, 15.0], and [14.2, 26.5] overlaps, merge them into [12.9, 26.5].
Goal: Merge the annotations together if they overlap
Extension 1: Dragging segments
We would like the ability to drag segments on the timeline. Remember the timing information below should also change.
For this, we do not want to write anything to the database, but merely update the state in the browser. You may use any state management approach you like, including any external state management libraries you feel would be helpful.
Goal: Add ability to drag segments
Extension 2: Merge segments (again).
If any segment is dragged such that two segments overlap, the segments should be merged.